Product Updates
Product Updates
Product Update: Tracking PLTR's Government Deals With New Dashboard
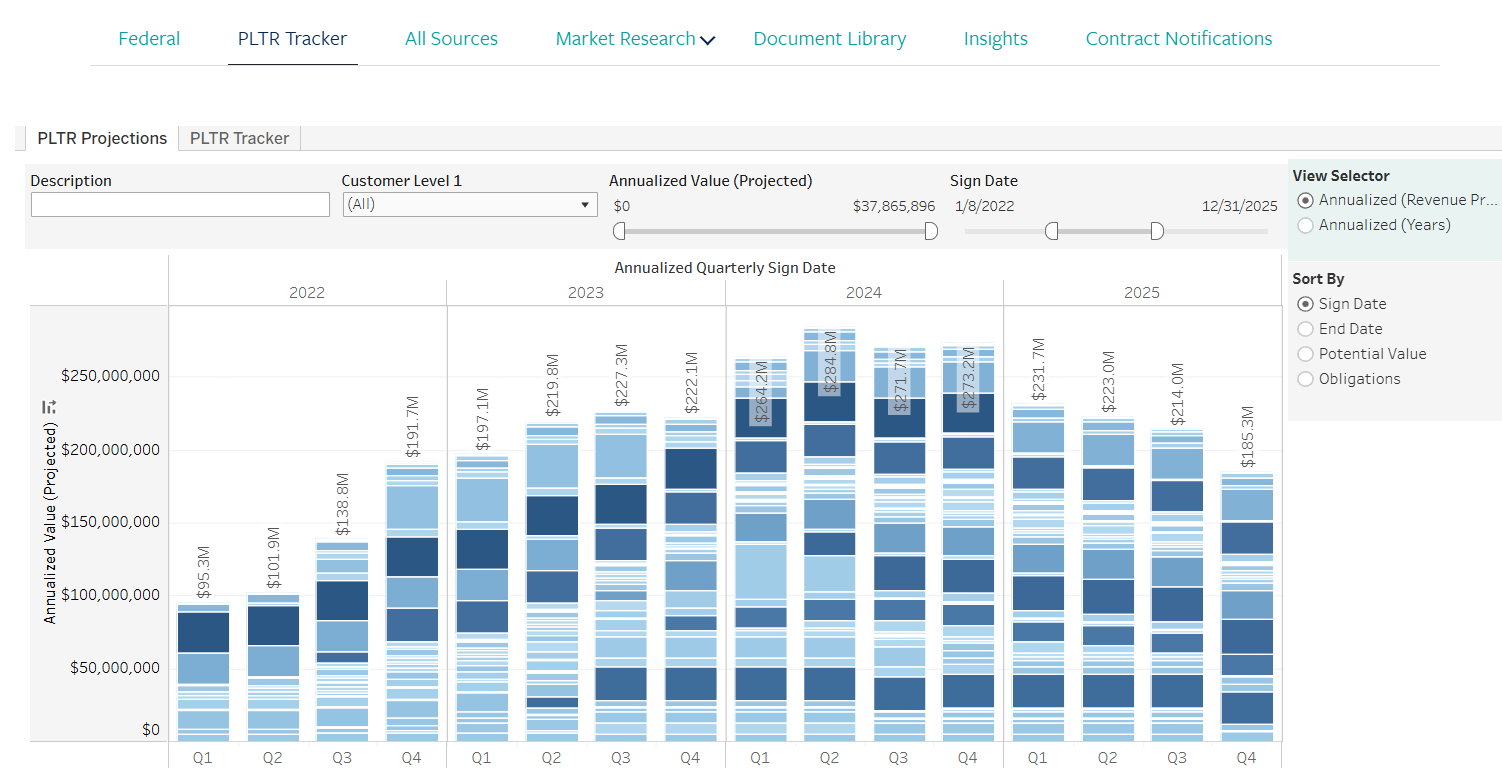
Summary: We are providing an updated dashboard for tracking Palantir's government business intended to address company-specific challenges with interpreting government-reported data. The dashboard, available under "PLTR Tracker" on the platform, is designed to provide a framework for estimating revenue growth attributable to Palantir's government segment based on publicly disclosed deals.
Background:
- Palantir's federal contract data differs from most other software companies in two respects:
- Some of Palantir's DOD awards, though publicly announced, are not included in the government's main spending database (FPDS).This means detailed data showing annual obligations is not available for select awards. For example, the government announced awards to Palantir for Army TITAN and AI/ML Research and Development, but does not provide obligations data in FPDS for these contracts.
- Some of Palantir's larger programs feature irregularly timed obligations. This can cause large swings in total obligations from one quarter to the next, though revenue recognition under these deals likely isn't so volatile.
- For these two reasons, PLTR's federal obligations in a given quarter won't necessarily track with the company's reported government results.
Dashboard Methodology: designed to provide a framework for estimating revenue growth attributable to Palantir's government segment
- The new dashboard assigns an "estimated total contract value" to each deal and distributes that value evenly on a monthly basis throughout each contract's duration.
- This approach ignores the volatility and incompleteness of PLTR's federal obligations data.
- For simplicity, our methodology allocates the value of these deals evenly over their duration. In reality, revenue from these deals likely ramps up or down based on factors such implementation schedules and changing program requirements.
- The dashboard is meant to serve as a guide to the drivers of government revenue rather than a precise projection of PLTR's reported revenue.
- In most cases, the estimated total contract value matches the total contract value disclosed in government data. However, in cases where the government-reported figure appears unrealistic based on the obligations disclosed to date, we have adjusted the estimated total contract value. Scrolling over any contract on the dashboard will display the estimated total value, the government-reported value, and the estimated quarterly contribution.
- The dashboard does not assume deals will be renewed. Future quarters include only projected revenue from unexpired deals. For example, contracts such as Army Vantage and Space Force Data-as-a-Service that have expirations in 2024 are not included in the projected revenue for 2025, though these deals have a high likelihood of continuing.
- The dashboard is available here.
Please contact Francessca Chiappinelli if you would like to schedule an analyst call.
Product Update: Q3 Federal Aggregate Data and Reseller Analytics
Summary: Nation Analytics is providing two new dashboards that provide real-time insight on overall federal software/hardware spending.
- Both screens currently indicate total Q3 2024 federal spending on software/hardware likely increased modestly year-over-year.
- The projections utilize our point-in-time methodology that adjusts for the Defense Department's 90-day disclosure lag by comparing transactions signed in the current period with transactions from the year-ago period that were disclosed as of the same date one year earlier.
- Aggregate Federal Analytics: This screen shows total federal obligations attributable to companies covered on the Nation Analytics Software/Hardware platform and provides aggregate point-in-time comparisons.
- Reseller Tracker: This screen shows total obligations attributable to 26 major federal resellers and provides aggregate and individual point-in-time comparisons.
- The screens are available on the platform under Market Research -> Aggregate Federal Analytics and Market Research -> Reseller Tracker.
- Below we provide details on the new dashboards and sample insights derived from them.
Aggregate Federal Analytics
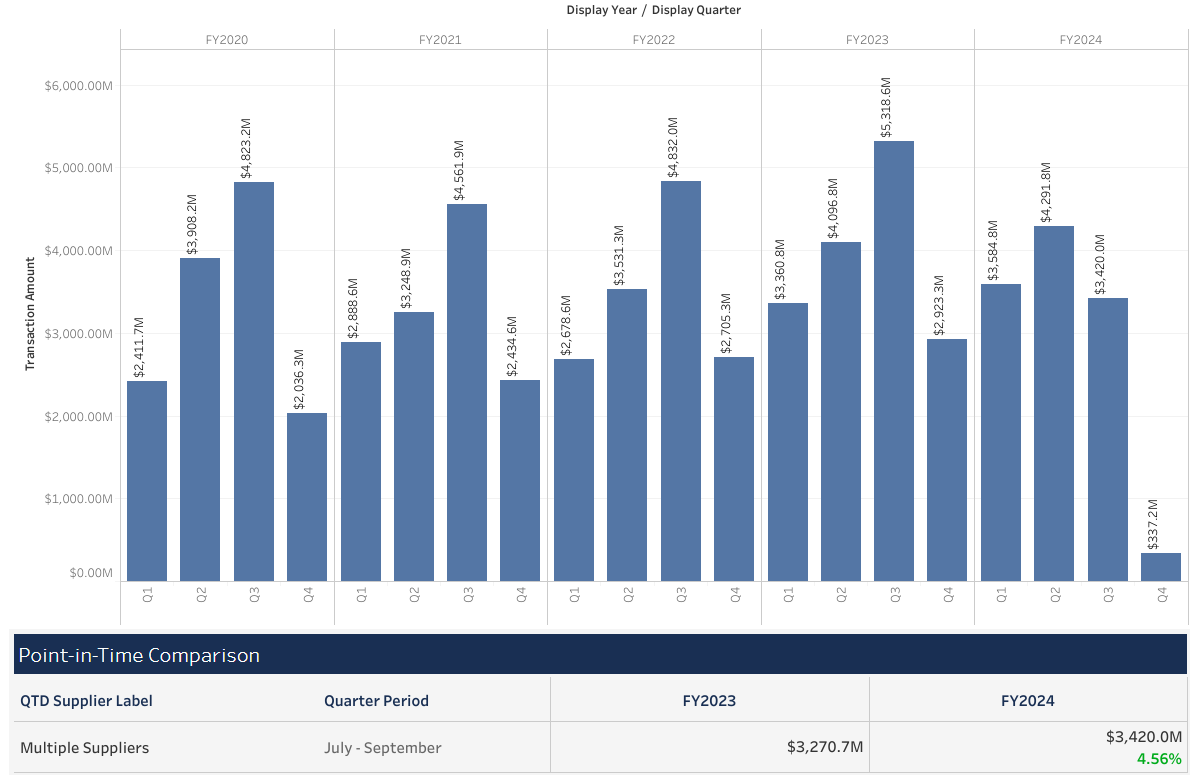
- With data through 10/22/2024, this screen shows total obligations of $3.42 billion signed in Q3 2024, a 4.6 percent increase vs. the $3.27 billion in Q3 2023 obligations that had been disclosed in government data as of 10/22/2023 (see Figure 1).
- Below the bar chart, the screen provides the point-in-time "Quarter-to-Date" calculation that compares obligations in Q3 2024 with obligations in the year-ago quarter that had been disclosed at the same point in the year in 2023.
- You can use the Supplier menu to create custom groupings of companies. The bar chart and Quarter-to-Date calculation will update based on aggregate obligations attributable to the selected group of companies.
- The screen is limited to publicly traded software/hardware companies (and a few companies that were recently public but have been taken private.) The included companies are listed in the Supplier dropdown menu.
- The screen is meant to be a broad market gauge. For this reason, we have excluded Palantir and Oracle's Cerner business from the screen to remove the effect of large outlier transactions from the calculations.
Figure 1 - Aggregate Federal Analytics Chart
Reseller Tracker - This dashboard includes total obligations attributable to 26 major federal resellers.
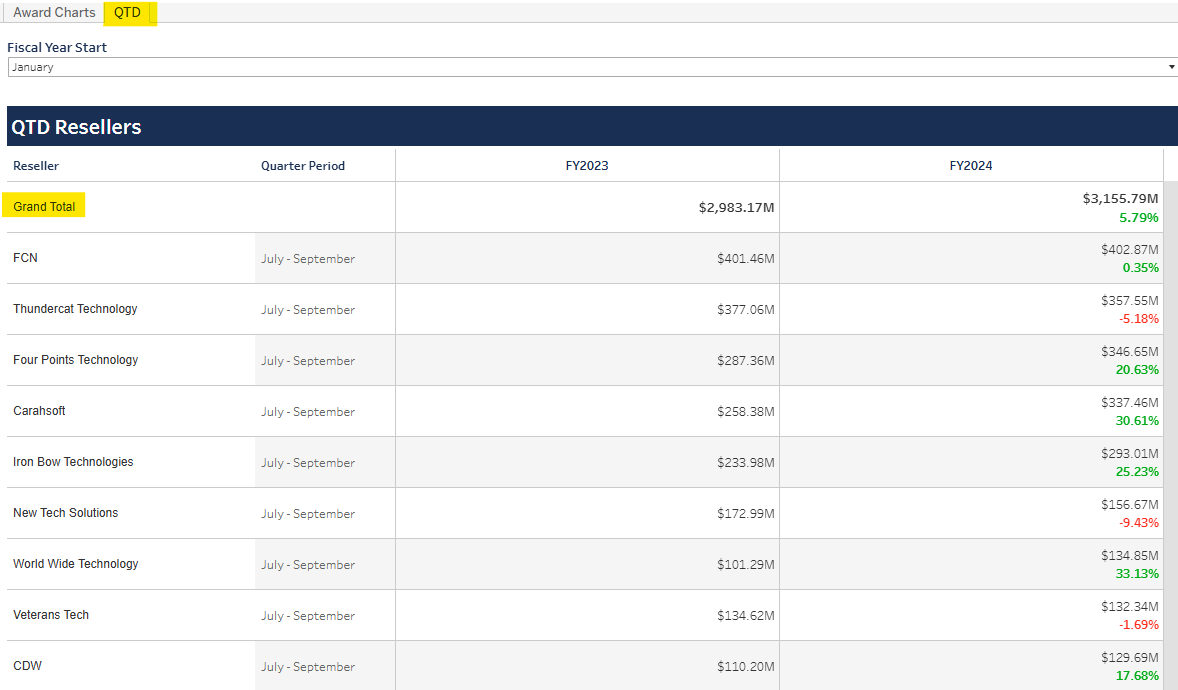
- With data through 10/22/2024, the screen shows $3.16 billion in obligations attributable to these resellers, a 5.8 percent increase vs. the $2.98 billion in comparable obligations for the group in Q3 2023 (meaning transactions that had been disclosed in government data as of 10/22/2023).
- The dashboard includes all federal transactions attributable to the resellers, those categorized under a software/hardware supplier covered on the Nation Analytics platform and transactions that are uncategorized (uncategorized transactions are orders where the government description does not specify a supplier or brand name, such as "Computer workstations" or "Talent and Learning Management System.")
- This more inclusive approach provides a broader gauge of government orders from the group of resellers.
- You can use the Reseller Name menu to view obligations for a single reseller or for a selected group of resellers.
- A second tab called "QTD" shows the point-in-time calculations based on reseller obligations in Q3 2024 vs. Q3 2023 (see Figure 2).
Figure 2 - Reseller QTD Calculations
Sample Insights
- Reseller CDW reported a slowdown in federal orders in Q2 2024 during its 7/31/2024 earnings call.
- The Reseller Tracker showed CDW's federal obligations were on pace to be weak in Q2 2024 ahead of the company's earnings report. As of 7/25/2024, CDW had federal obligations of $41.2 million in Q2 2024, a 32 percent decline vs. $61 million in comparable transactions in Q2 2023 (meaning obligations disclosed as of 7/25/2023).
- For Q3 2024, the Reseller Tracker currently shows CDW's federal obligations are up 17.7 percent vs. Q3 2023, based on the point-in-time comparison.
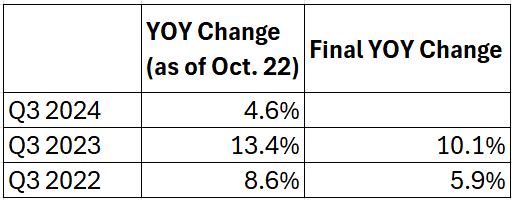
- The data included on the Aggregate Federal Analytics dashboard has proved to be a decent directional indicator of overall federal software/hardware spending the past two years.
- The table below (Figure 3) shows the Q3 YOY percentage change for the aggregate data set calculated using data through Oct. 22 for each year, alongside the Final YOY Change percentage, which is calculated using complete data that includes Defense Department transactions disclosed after the 90-day lag.
Figure 3 - Aggregate Data 2-Year Predictive History
Please contact Francessca Chiappinelli if you would like to schedule an analyst call.
Enhanced Federal Data for NOW/CRM
- We have enhanced the contextualized data we are providing for Salesforce and ServiceNow (available on the platform under Market Research -> NOW/CRM Tracker).
- The views are based on a detailed analysis of US Federal data that categorizes each transaction as Net New, Expansion, or Renewal.
- Renewals and Expansions are linked to predecessor deals, allowing us to calculate the incremental amount for each deal.
- The screen has two "View Selector" options:
- Categorized view: Chart shows the total value of transactions signed by quarter, color-coded by category.
- Incremental Amount view (shown below): Chart shows the net incremental value of transactions signed in each quarter. For Renewals and Expansions, this is the difference between the value of the latest transaction and its predecessor; for Net New transactions this is the total value of the transaction. The gray line indicates the total value of transactions.
- The detailed data showing the incremental amount for each deal is available below the bar chart.
- TIP: Use the "Date Added" filter to do a point-in-time incremental value comparison.
- For example, for ServiceNow's Q3, the tracker shows an Incremental Amount of $118 million as of 10/24/2023 (with the Date Added filter set to 10/24/2023), vs. $65 million for Q3 2022 (with the Date Added filter is set to 10/24/2022).
- This is an increase in incremental value of ~80 percent, close to the company reported figure.
Aggregate Federal Market Analytics
- A new "Market Research" section includes screens for tracking aggregate federal spending on Software/Hardware and award activity in 10 high-level categories (AI, Business Process Applications, Cloud Infrastructure & Services, Communication & Productivity, Cybersecurity, Data Management & Analytics, Engineering & Developer Tools, Health IT, IT Management, Networking & Hardware).
- The "Categories Overview" tab shows historical spending by quarter (Figure 1). Change the "View By" option to "Aggregate" to see total spending for all Software/Hardware vendors covered in our data set.
- Use the "Level 1 Category" menu to view a single category.
- Use the "Supplier" and "Product" filters to remove vendors from our pre-defined categories.
- The "QTD Monitor" tab shows point-in-time YOY comparisons for aggregate federal Software/Hardware spending and awards within each category (Figure 2).
- The QTD Monitor updates daily and adjusts for the 90-day lag in Defense Department data disclosure by comparing award activity in the current period with awards signed in the year-ago period that had been disclosed as of one year ago. This provides an apples-to-apples comparison and is the best way to gauge federal spending levels in real time.
- Scroll down to view the "Supplier Level Detail" chart that shows individual contributors to each category.
Figure 1
Figure 2
New Federal Views
- An updated user interface makes the Federal data set easier to navigate and adds new functionality.
- Some highlights include:
- Award Charts: The new default screen consolidates several tabs into a single dashboard (example screenshot below). Using the "View Selector" menu in the upper right, users can view obligations by government agency (Level 1 Customers), or government bureau (Level 2 Customers), among other options. Transaction details are provided below the chart (this data was previously available on a separate tab called Obligation Data).
- Expirations: This tab makes it easy to see when major contracts are set to end.
- Comp Scanner: This new screen ranks suppliers by percentage growth in federal awards in the year-ago quarter. This makes it easy to identify suppliers that face difficult/easy year-over-year comparisons in federal.
- Please contact us with any questions or to schedule an analyst call.
- You can revert to the old federal views by selecting "Switch to classic view" on the right side of the screen.
Contract Notifications
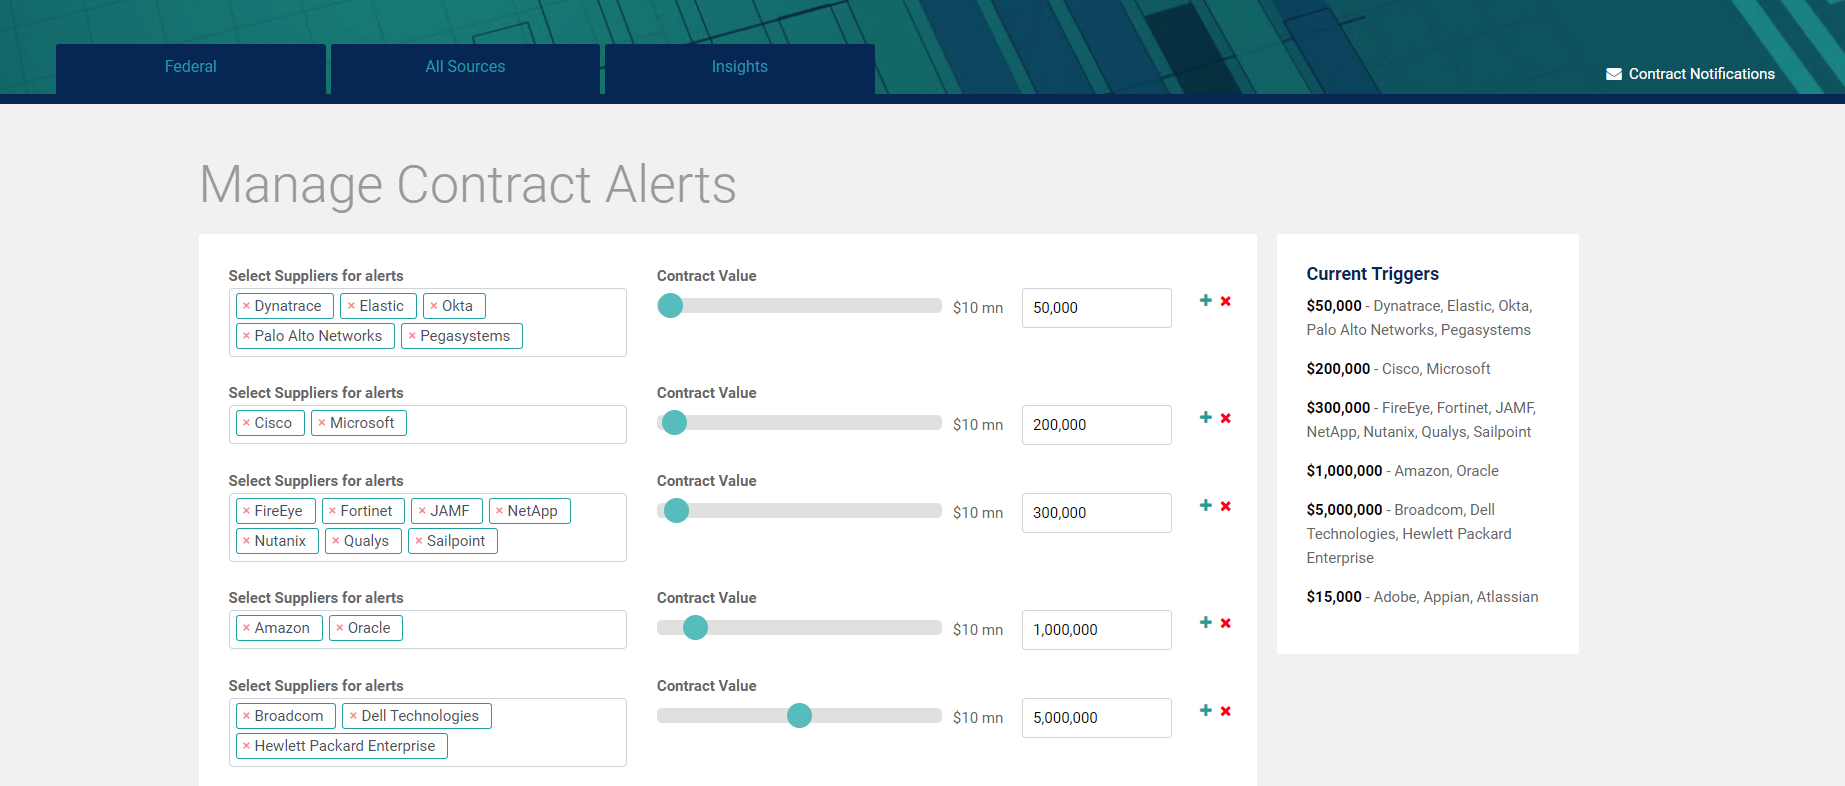
- Users can now create/edit email alerts by logging in to their account and selecting "Contract Notifications."
- Alerts can be configured to trigger at different value thresholds for different groups of suppliers (see example below).
- Email notifications can be scheduled for daily, weekly, or monthly delivery.
- Users who already receive email alerts DO NOT need to take any action. Notifications have been configured based on current criteria. However, adjustments to notification criteria (adding suppliers, changing value thresholds) can be made by selecting "Contract Notifications" and submitting changes.
New Suppliers Added
- Rackspace, Snowflake, MobileIron, JFrog, JAMF, and Iron Mountain have been added to Software/Hardware
New Data Source Added
- Contracts awarded by the state of Pennsylvania have been added to Software/Hardware
New Supplier Added
- Palantir has been added to Software/Hardware